Aug 26, 2024
Report & Analytics
OrbinaAI improves the efficiency of your customer interactions by facilitating a deeper understanding of them. Analyzing customer conversations is vital for any organization, no matter what tools you use, and that's why it's our focus.
We have placed OrbinaAI's chat analytics, along with your other AI chatbots, in a prime location on your main dashboard for easy access. This guide will help you understand the most critical metrics within OrbinaAI chat analytics and how you can use them to gain valuable insights from your customer interactions.
Conservation Ratings
The Conversation Ratings section measures your conversation ratings compared to the industry average. It represents the distribution of ratings across 1 through 5 stars. Each star rating has a percentage of conversations. A horizontal bar graph is thus used, whereby the segments are colored proportionally to the percentage of conversations that had a particular rating. This data will enable you to understand the quality of customer interactions, compare your performance with industry standards, know the opportunity for improvement, and follow customer satisfaction trends over time.

New Conservations
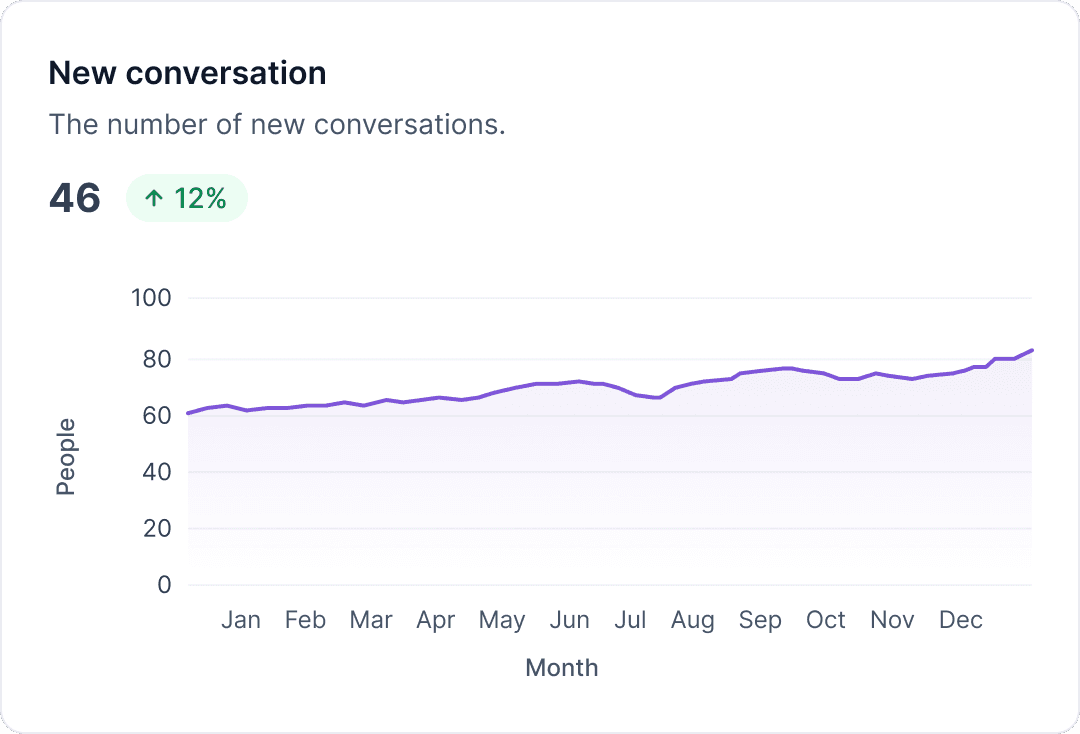
New Conversations section will record the number of new conversations initiated over a selected period, reflecting user engagement and platform activity. From the line graph from January to December, one can observe a continuous increase in new conversations, reflecting growth trends to help follow monthly performance. The indicator percentage change gives a bird's eye view of the growth compared with the previous period and helps evaluate performance and strategic planning.
Average Message Count per Conservation
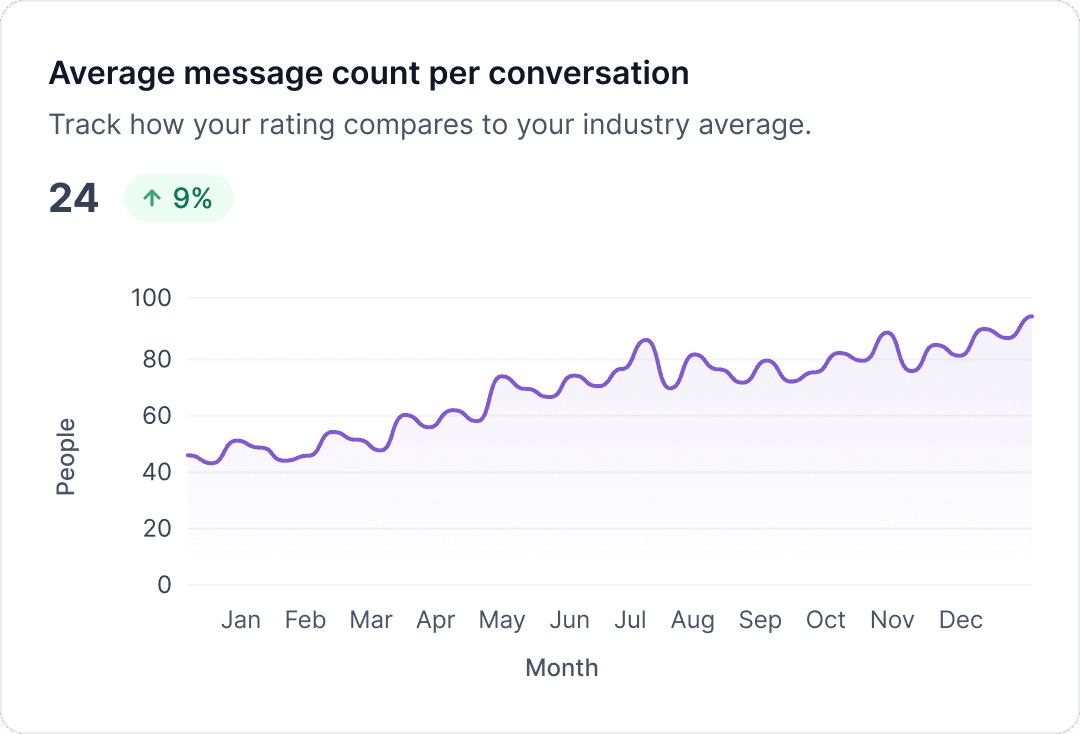
Average Message Count per Conservation section keeps track of the average number of messages exchanged per conversation, and hence reports insights about the depth and level of interaction going on. The line graph indicates that the growth in the average message count has been consistent from January to December, thus showing that user engagement with the chatbot is growing over time. The indicator percentage change underlines growth compared to a previous period; hence, it aids in the assessment of performance and helps make strategic decisions.
💡Tip
Need more help? Get support at info@orbina.ai
Find answers and get help from Orbina Support and Community Experts
